Sensor.community Particle Matter viewer
10% frontend + 90% backend
10% frontend + 90% backend
Miska's role :
design, code, and data cleaning.
technologies :
html, javascript, leaflet.js, canvas, Postgresql, Python Pandas
Project description (quick) :
Viewer of near realtime and high volume historical Particle Matter data, collected by the 12,000 volunteer strong sensor.community project. Project involved 90% backend work and 10% frontent design+coding.
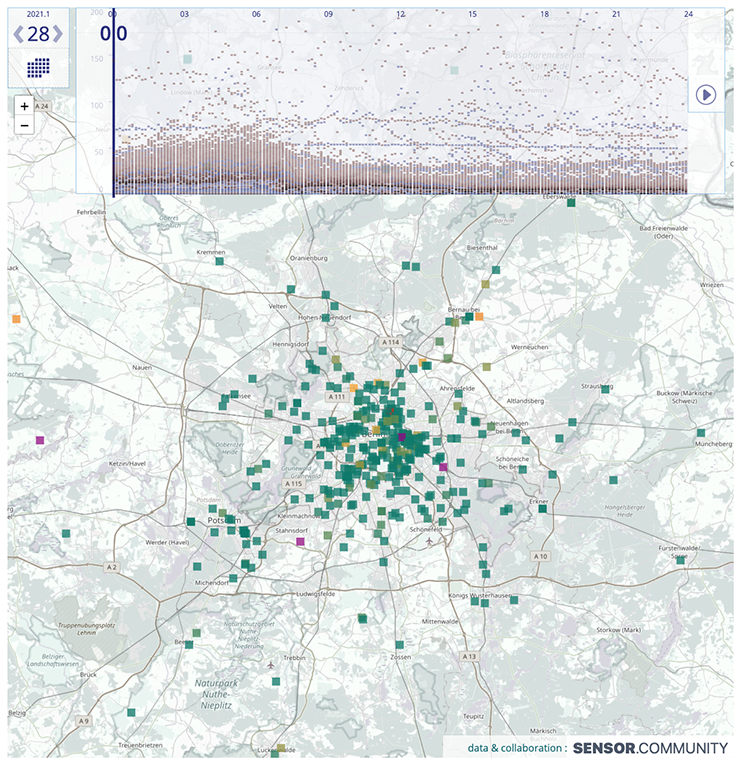
Viewer, showing Particle Matter measurements from the 12,000 citizen scientist volunteers. Time series plot of values in current map view, by the time selection area.
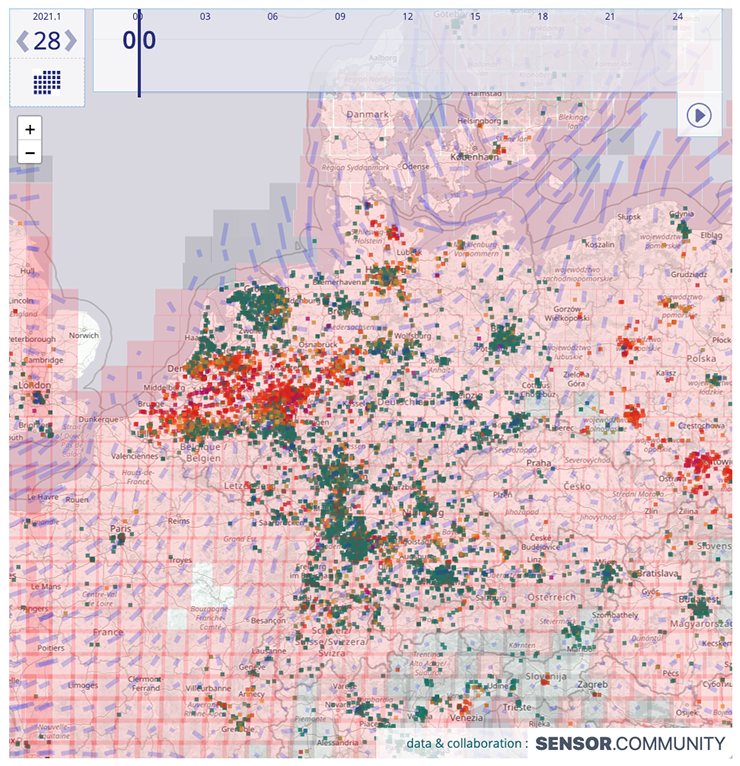
Experimental viewer. Additionally shows wind direction + speed, as well as areas where the relative humidity (rH) is so high the PM sensors likely overestimate PM counts.
Project description (longer) :
This viewer, of citizen science project sensor.community gathered Particle Matter (PM)* data, was 10% frontend coding and 90% backend coding.
* Micron sized particles, usually emitted through burning fossil fuels, that can cause serious health damage at higher levels.
The sensor.community citizen science network has 12000 participants. Each has set up an inexpensive, but accurate, particle matter sensor, submitting PM data every 2.5 minutes.
Alas, the project lacked the resources to make a viewer showing historical Particle Matter data. To see tendencies and development in data, a historical viewer is important. So I decided to make one.
The largest stumbling block was that the project had no database API for historical data. So I had to develop a system gathering near realtime data, cleaning it, putting it into a database, and then synthesizing a compact json file with near realtime historical data, every few minutes.
The webpage
The webpage uses the leaflet.js framework to generate the map background. The sensor data is drawn on a canvas layer on top of the map. The canvas html component was used instead of SVG, as it allows screen redraws ca 5-10x faster than SVG.
The timeline also show a time series plot of data values, of the sensors within the current map view. This helps people get a sense of the overall PM levels in the current view, over time.
The data
The data for the project - more on this below - is served up as 24 hour long csv files, with all the data from all sensors. While this solution might not scale all too well, it is less demanding on limited server capacity.
The backend
To produce the historical visualisation, historical data was needed. Alas, the sensor.community doesn’t have the resources for a server offering up historical data via an API.
Consequently, I’ve produced a solution that grabs the realtime data, updated every 2.5 mins by sensor.community, cleans the data, puts it in a postgresql database.
Every 8 minutes, an optimised json file is produced and served, with the data from the last midnight until the latest measurements. As most users will look at the data from the current day, this data file works quite well for most needs.
A bonus effect of producing data files this way is that, at the end of a day, one will have a data file for the whole 24 hours. These previous dates data files can be accessed via the web viewer too. Thus one creates realtime data and historical files all the same time.
Version 2 backend
For a future version, currently in some alpha phase, wind direction, wind speed and relative humidity data is included in the visualisation.
( Thanks very much to the Norwegian Meteorological Institute, for providing an (aka MET Norway Weather) API to current weather forecast data, for the whole world. .
The API allows one to gather weather forecast data for the next 72 hours. The data is updated four times a day.
The data is very useful for two reasons. 1. it allows users to get an idea of where PM pollution might stem from, and where it’s going. 2. Due to high humidity intolerance from the sensor.community PM sensors, values can be inflated at humidity levels above 70-80% relative Humidity (rH). I’ve used the relative humidity from Met.no’s Weather API to indicate when sensors experience excessive levels of humdity.
Recipe for gathering and using weather data :
1. Produce a grid of 25x25km of the whole world.
2. Find the abovementioned global grid points within 50 km of a sensor.
3. Gathering weather forecast data, using the MET.no Norwegian Weather API, one sensor at a time.
4. Updating the gathered weather forecast data as the forecast is updated, 4x daily.
5. Cleaning and storing the data.
6. Synthesising a json file, 4x a day, with the latest forecast data, for the web based visualiser.
( The synthesized weather data json file also has time series ‘missing data’ filled in, such that the browser doesn’t need spend time fixing ‘missing data’. )