solar radiation
Miska's role :
design, code, and data cleaning.
Project description :
The sunlight tracing project is an experiment in showing light measurement data (from Helsinki, Finland). In total there’s about seven months of data, throughout the animation, from August to December 2007.
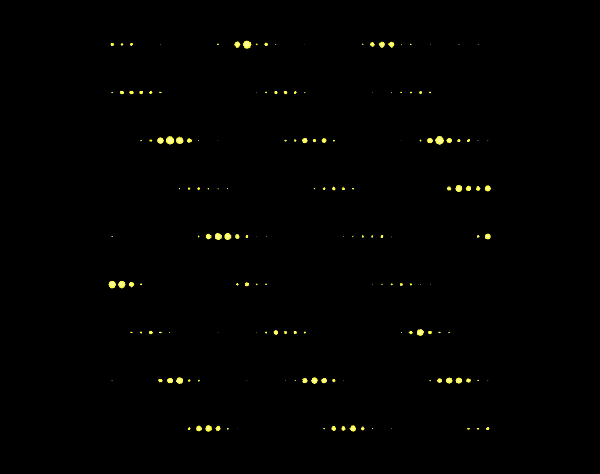
The technique basically moves the wind data through some holes. The size of the circles correspond to the measured light quantity. Days look like creatures going along a track.
What this technique allows to make more visceral, which other techniques might not, is the variations in cloud cover. When the cloud cover has been quite varying - eg. spotty cloudiness - the visualisation flickers a great deal.
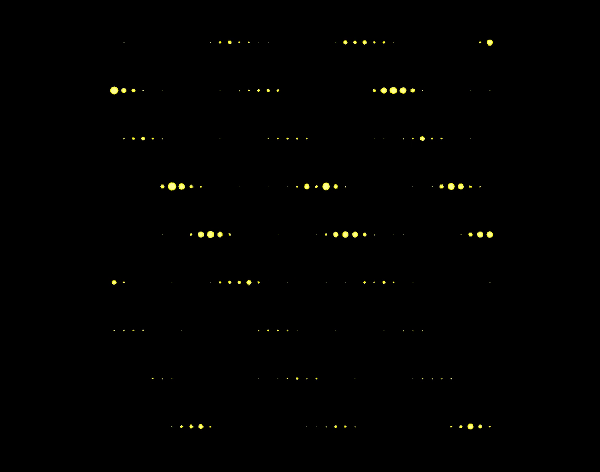
As the animation covers time from August to December, as it progresses, things get gradually darker.
related work : sun/shade and 24 hour images
design, code, and data cleaning.
Project description :
The sunlight tracing project is an experiment in showing light measurement data (from Helsinki, Finland). In total there’s about seven months of data, throughout the animation, from August to December 2007.
The technique basically moves the wind data through some holes. The size of the circles correspond to the measured light quantity. Days look like creatures going along a track.
What this technique allows to make more visceral, which other techniques might not, is the variations in cloud cover. When the cloud cover has been quite varying - eg. spotty cloudiness - the visualisation flickers a great deal.
As the animation covers time from August to December, as it progresses, things get gradually darker.
related work : sun/shade and 24 hour images
Lighttracing animation - showing the darkening of the "light-year", starting from September 2007
Below are some screnshots of the light visualisation showing different moments in the Helsinki "light-year".
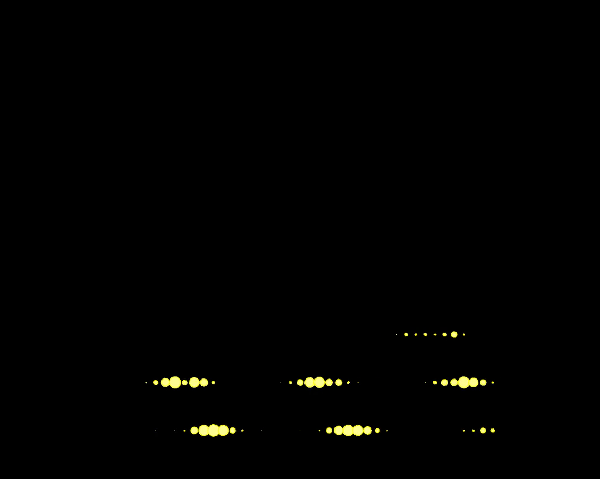
Visualisation screenshot : early August days
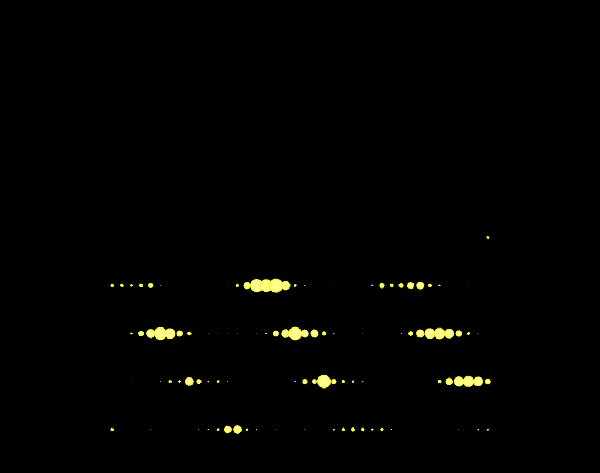
Visualisation screenshot : later August days
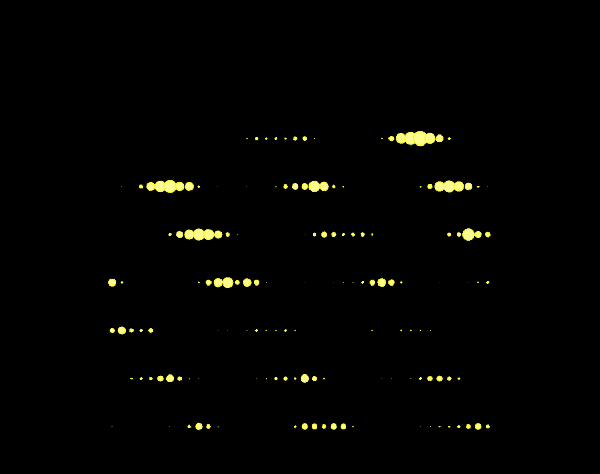
Visualisation screenshot : October days
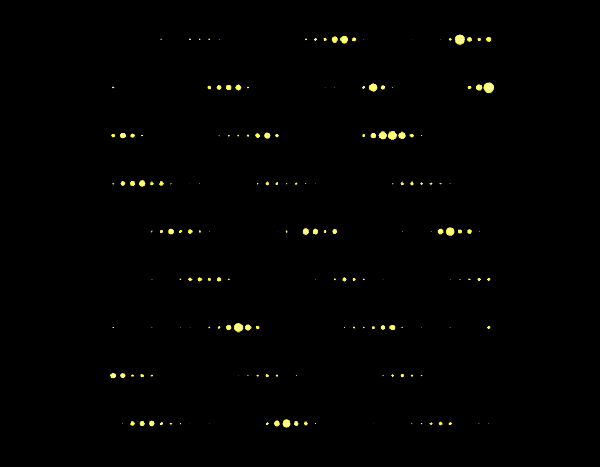
Visualisation screenshot : November days
Visualisation screenshot : December days (yeps, it's dark up here in the Nordic winter
Visualisation screenshot : January days